It’s the most wonderful time of the year!
It’s the week of Christmas which means that it’s one of the busiest times of the year. We’re taking a look at the average wait times in ALL FOUR PARKS! Let’s see how the Christmas week crowds at Disney World affected the wait times!
Magic Kingdom
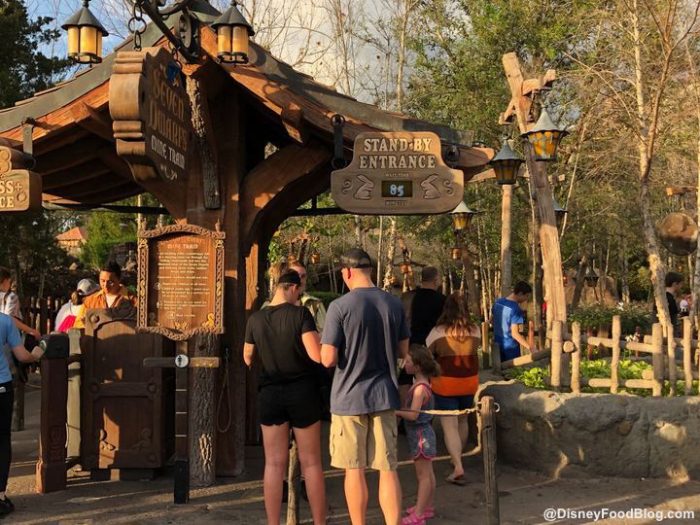
Step aside Frozen Ever After, because the longest wait in Disney World for Christmas week was for Seven Dwarfs Mine Train with an average wait of 75 minutes!
This average time went up by over 10 minutes this week! Several other popular attractions at Magic Kingdom had lengthier waits, but not nearly as long as Seven Dwarfs Mine Train.
Space Mountain averaged 51 minutes, Big Thunder Mountain Railroad averaged 50 minutes, Jungle Cruise and Splash Mountain averaged 43 minutes, and Pirates of the Caribbean averaged 41 minutes.
Get the Big Thunder Mountain Railroad 40th Anniversary MagicBand online!
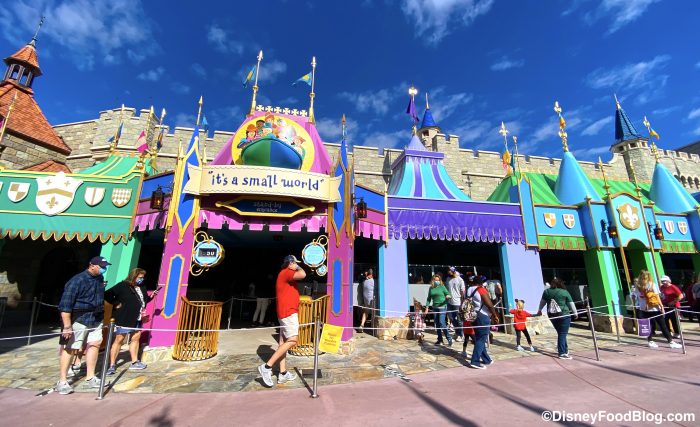
With average waits in the 30s, we have Prince Charming Regal Carrousel at 37 and “it’s a small world” at 39 minutes, Astro Orbiter at 35 minutes, Peter Pan’s Flight at 33 minutes, and Buzz Lightyear’s Space Ranger Spin at 33 minutes.
Despite colder weather, Splash Mountain’s wait times have gone up again, and overall, almost every attraction’s averages have gone up by a few minutes at least compared to last week.
Learn more about the Princess and the Frog redesign on Splash Mountain
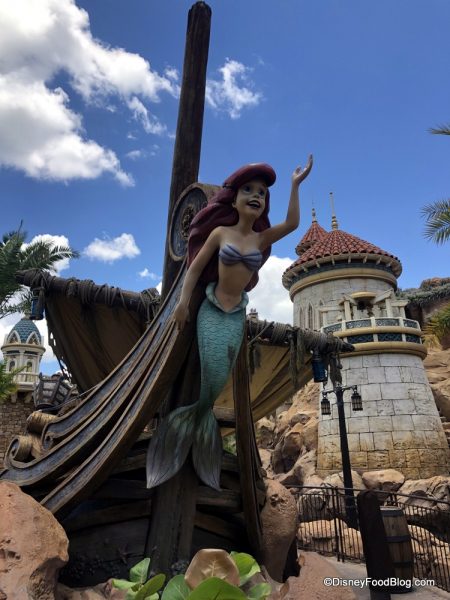
Under the Sea — Journey of the Little Mermaid (19 minutes), Haunted Mansion (21 minutes), Barnstormer (23 minutes), Many Adventures of Winnie the Pooh (23 minutes), and Mickey’s PhilharMagic (27 minutes), all had fairly short average wait times!
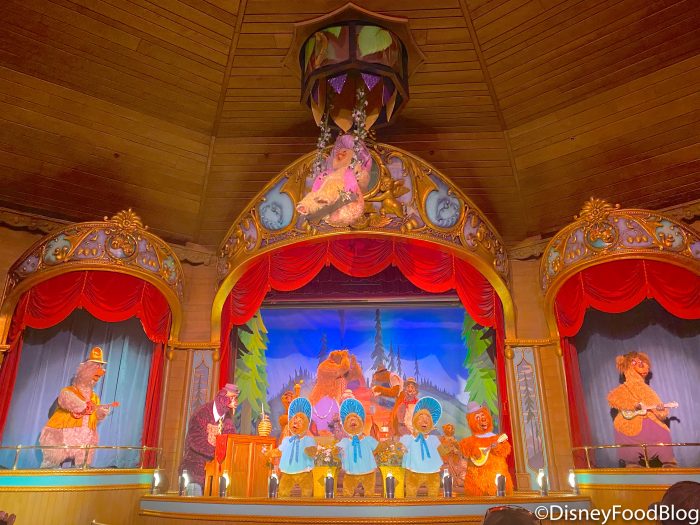
We also saw shorter wait times at Country Bear Jamboree with 10 minutes, Magic Carpets of Aladdin and Carousel of Progress with 13 minutes, Mad Tea Party with 14 minutes, Dumbo the Flying Elephant with 15 minutes, and Tomorrowland Speedway with 18 minutes.
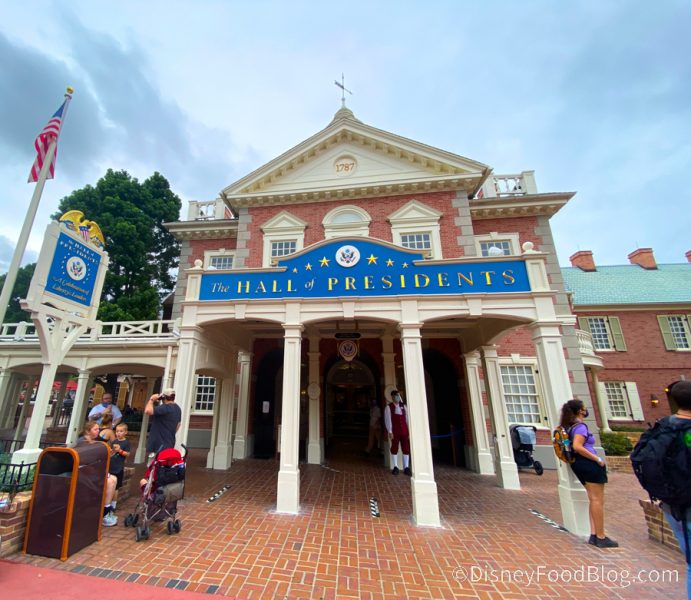
And some attractions continued to have a 0-minute average wait including Swiss Family Treehouse, Enchanted Tiki Room, and Hall of Presidents.
Almost every attraction in Magic Kingdom had a higher wait time than last week. Magic Kingdom is a hotspot for the holidays, especially on days like Christmas Eve and Christmas, so it’s no surprise to see a spike in wait times! Seven Dwarfs Mine Train went up significantly, but we’ll see how it compares next week!
Click here to see the latest in Magic Kingdom
EPCOT
EPCOT’s wait times were WAY different than we’ve seen before! Many of these wait times actually went DOWN!
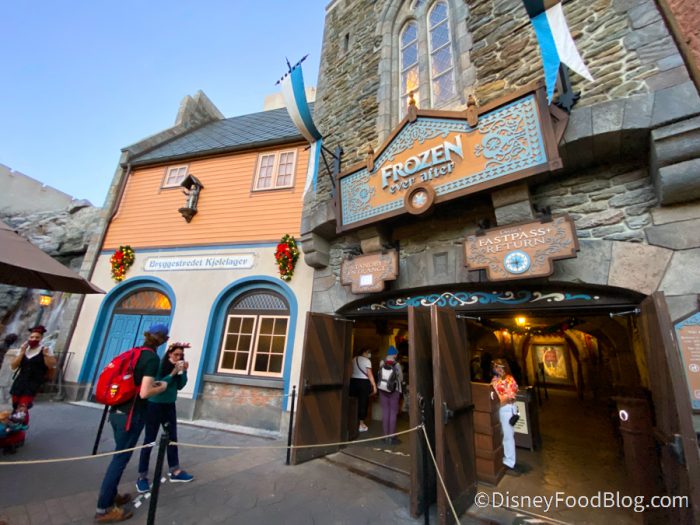
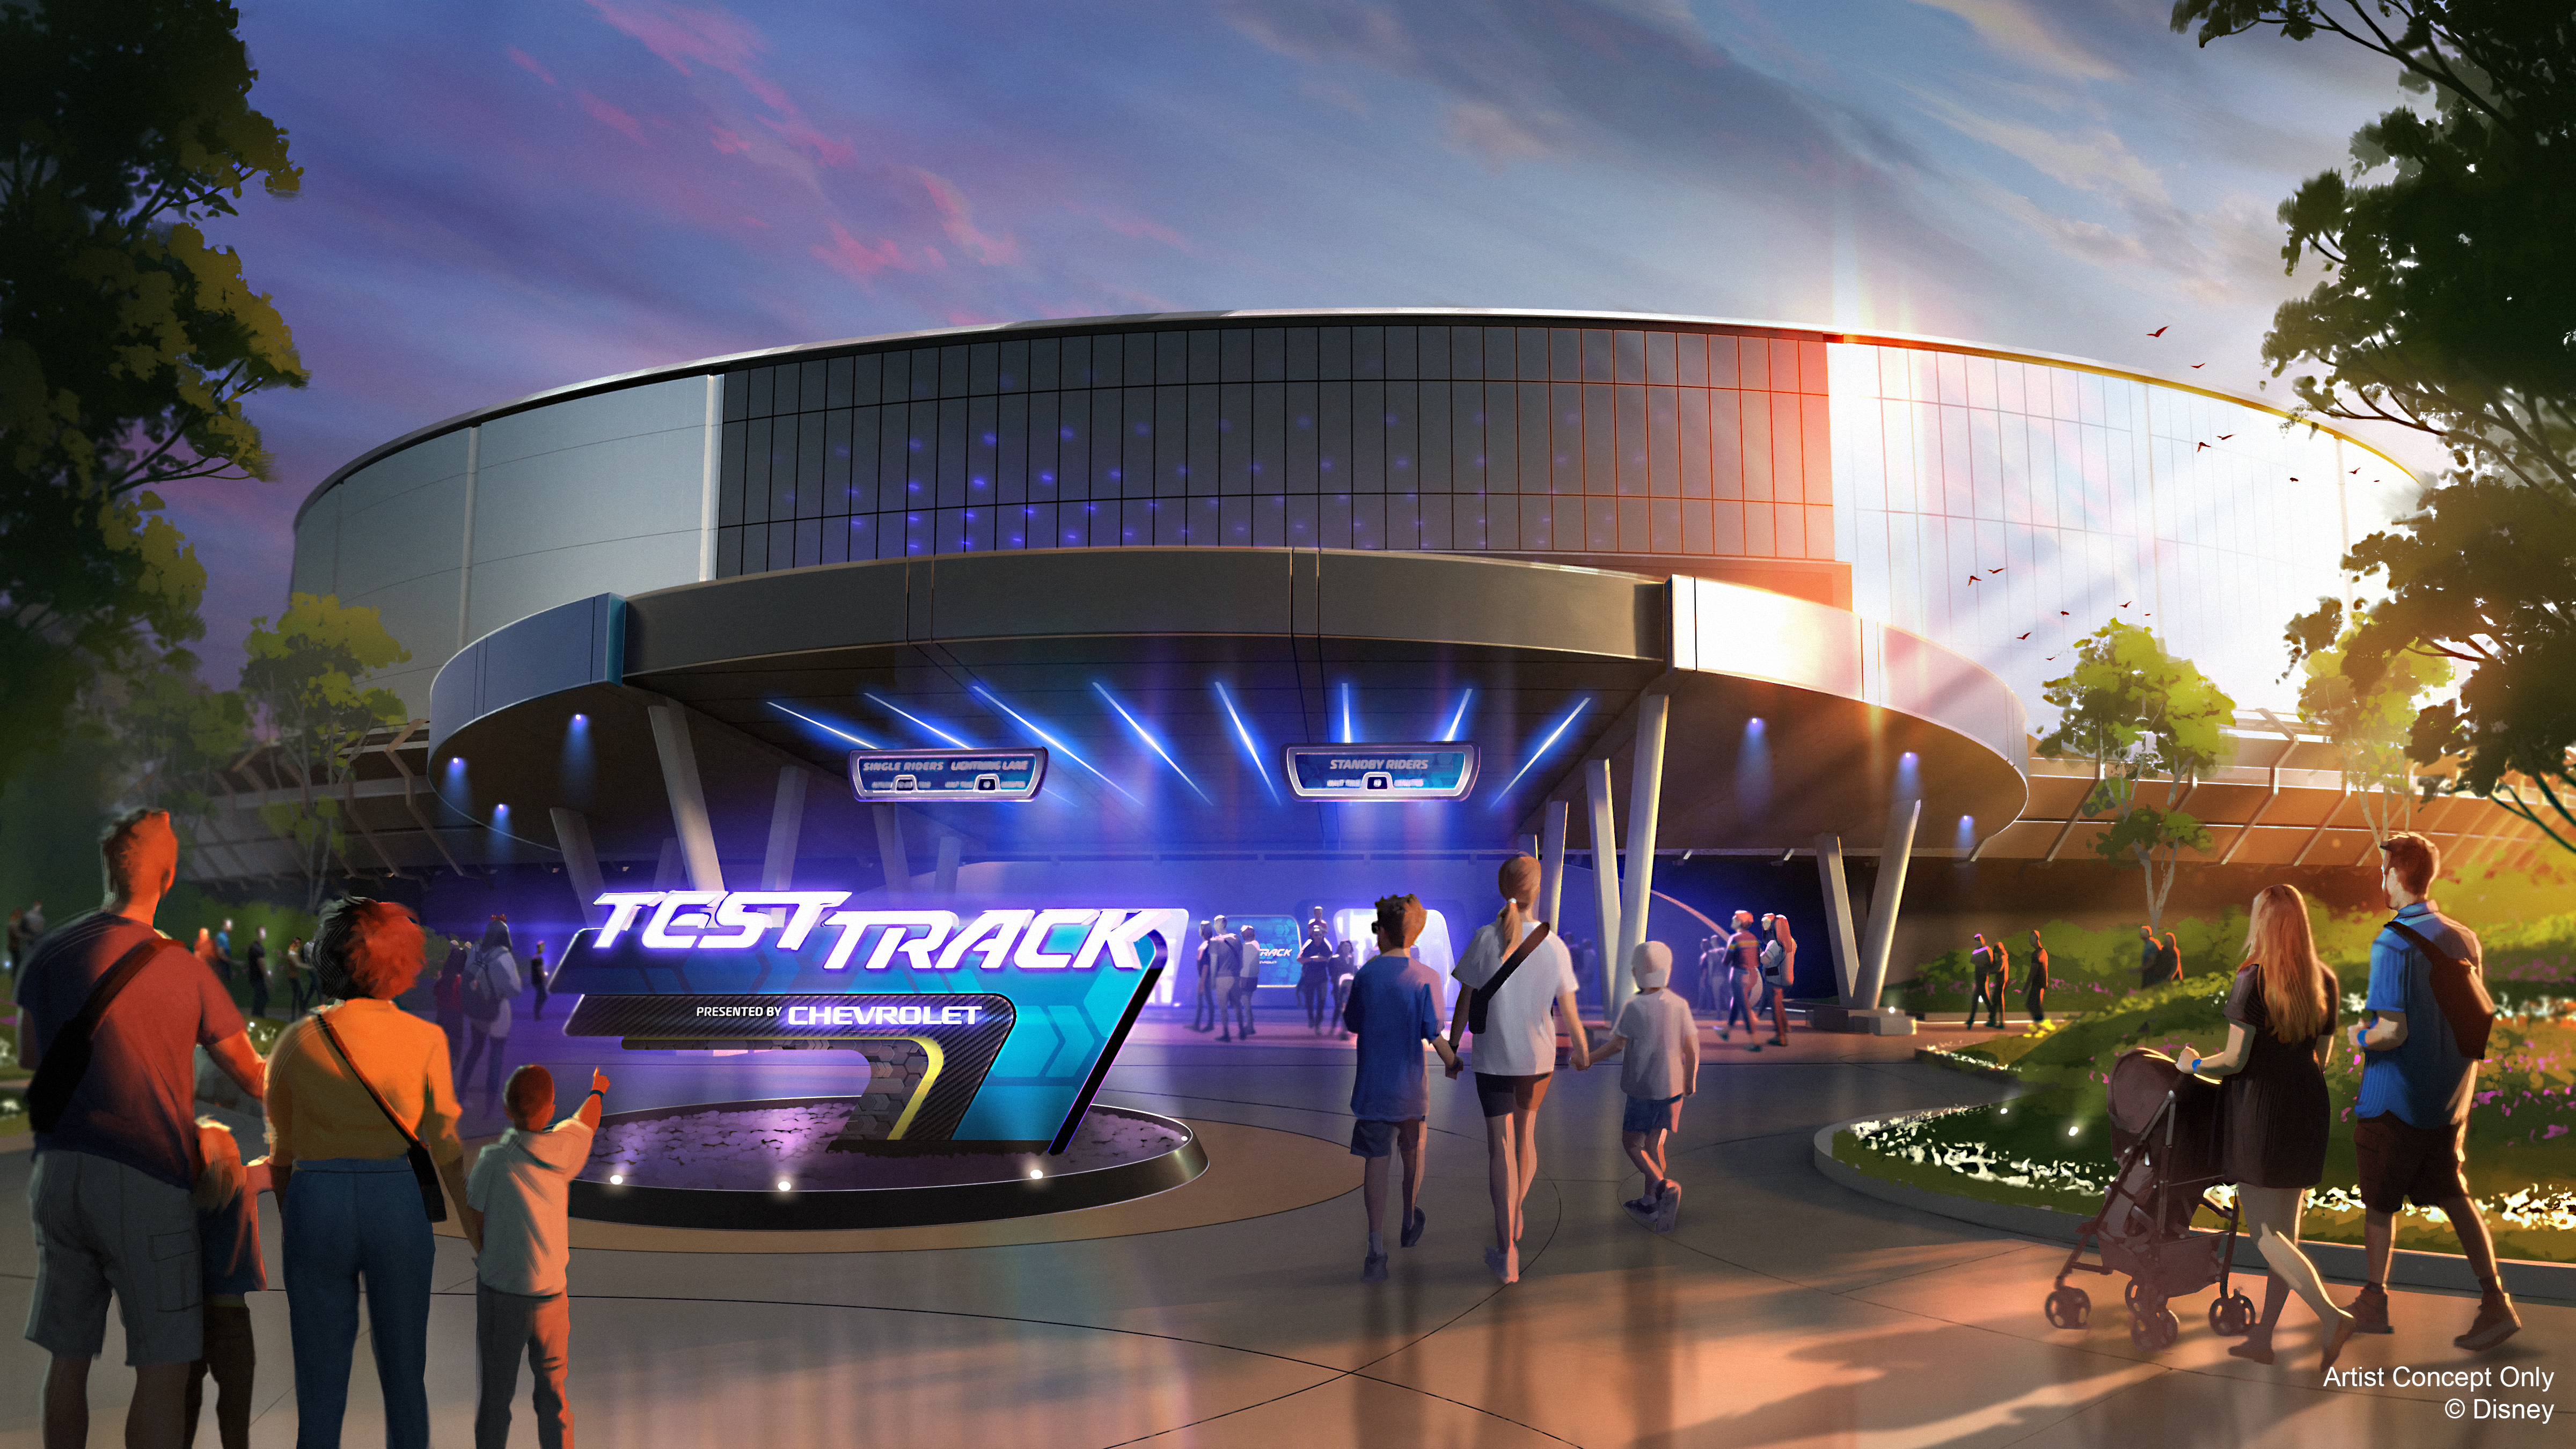
What was the longest wait time in all of Disney World for three weeks in a row has been cut IN HALF! Frozen Ever After had an average wait time of only 32 minutes this week! We were mind-blown by this small number. So now, the longest wait time in EPCOT for the week is Test Track with a 59-minute average.
Check out a virtual showing of Disney Cruise Line’s Frozen Show!
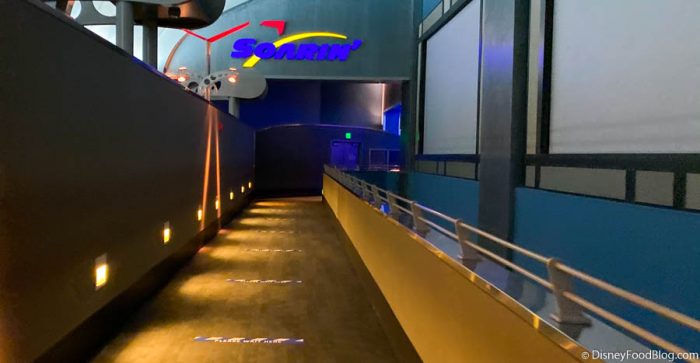
Soarin’ at 33 minutes, and Mission: SPACE at 36 minutes had fairly average wait times this week.
Attractions with shorter wait times in EPCOT included, Spaceship Earth at 14 minutes, Journey into Imagination with a 13-minute average, Gran Fiesta Tour had a 10-minute wait, Living with the Land had a 9–minute average, and The Seas with Nemo and Friends had a 7–minute average.
All of the films around EPCOT (Disney and Pixar Short Film Festival, Beauty and the Beast Sing-Along, Awesome Planet, Impressions de France, Reflections of China) and American Adventure averaged a 0-minute wait.
We were shocked at how low some of these average wait times were in EPCOT! Maybe people were enjoying the booths and entertainment for the EPCOT International Festival of the Holidays instead of riding attractions? Frozen Ever After was the biggest shock of them all since it had the longest wait on property for three weeks in a row!
Click here to see the latest updates at EPCOT
Disney’s Hollywood Studios
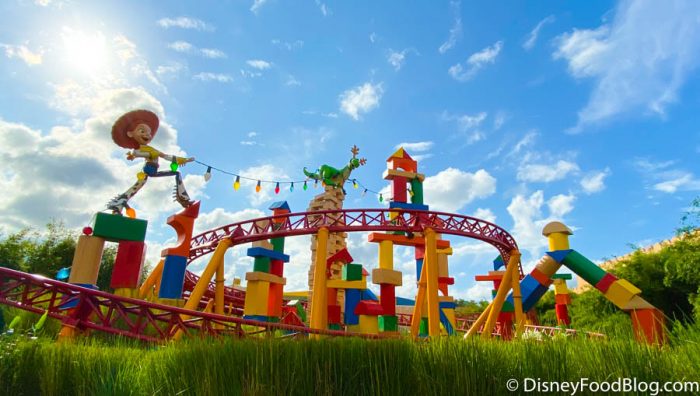
This week, Slinky Dog Dash had a 60-minute average. This is higher than last week, but it was STILL not the longest in the park anymore!
Reminder: Rise of the Resistance isn’t included since the virtual queue gets rid of traditional wait times.
The Rise of the Resistance boarding group change is in action in Disney World
Millennium Falcon: Smugglers Run took the top spot coming in at 65 minutes and Tower of Terror was close behind coming in at 62 minutes. Slinky was closer to the top than last week, but it is still a bit surprising to see it had the 3rd highest wait time!
Rock ‘n’ Roller Coaster came in at 43 minutes, and Mickey and Minnie’s Runaway Railway came in at 39 minutes, which was much higher than last week’s times.
Take a virtual ride on Mickey and Minnie’s Runaway Railway!
The other attractions in Hollywood Studios had pretty average wait times.
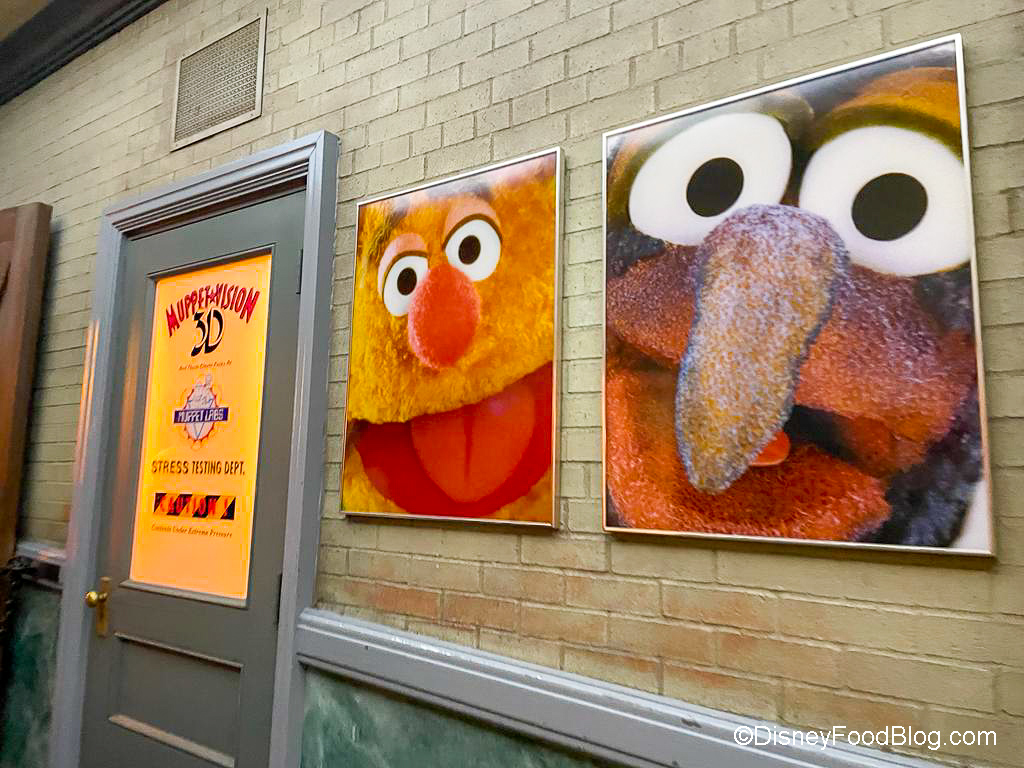
Lightning McQueen’s Racing Academy averaged 33 minutes, Star Tours — The Adventures Continue averaged 32 minutes, Toy Story Mania averaged 29 minutes, Alien Swirling Saucers averaged 28 minutes, Muppet*Vision 3D averaged 26 minutes.
Since Hollywood Studios tends to be one of the more popular theme parks in Disney World, reservations can fill up earlier than any of the other parks. This is why we see higher wait times and fewer low wait times on the attractions. Also, Hollywood Studios doesn’t have as many attractions as a park like Magic Kingdom, so it can get congested, especially during a holiday week!
Check out the latest news in Disney’s Hollywood Studios
Disney’s Animal Kingdom
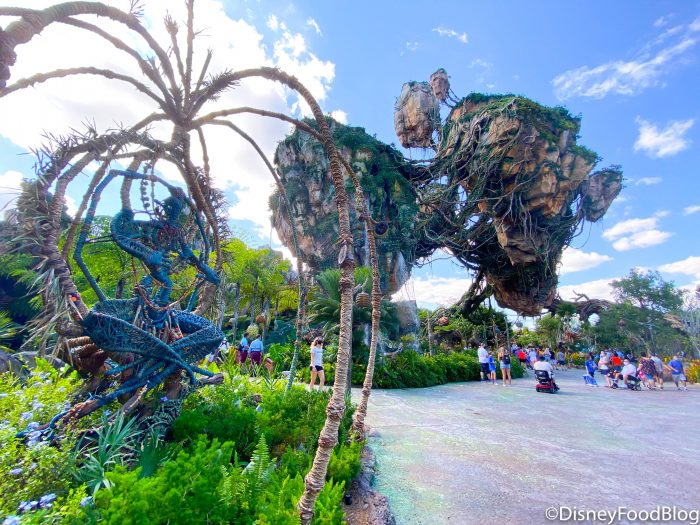
As usual, the Pandora — Land of Avatar attractions had the longest waits in Animal Kingdom with a 64-minute wait at Flight of Passage and a 51-minute wait at Na’vi River Journey.
These wait times went down just a little bit this week.
Check out the new animals on Kilimanjaro Safaris!
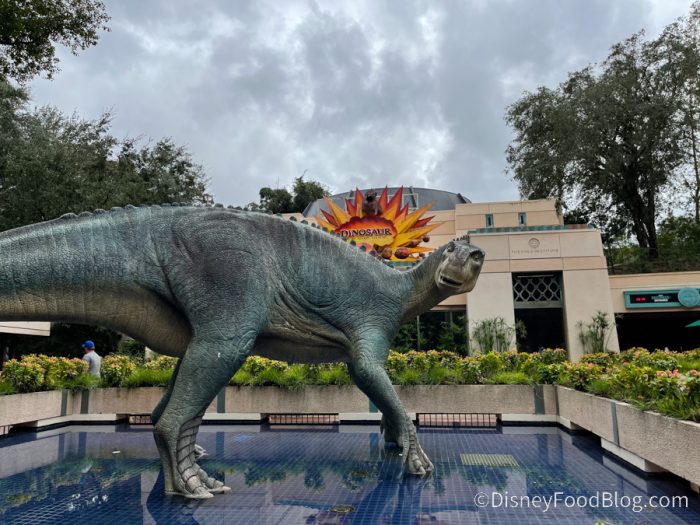
Thrill rides at the park continue to take the next highest wait times! DINOSAUR had an average of 30 minutes, Expedition Everest had an average of 23 minutes, Kilimanjaro Safaris had an average of 21 minutes, and It’s Tough to be a Bug had an average of 17 minutes.
The wait times above went down and we didn’t see anything outside of Pandora have a wait over half an hour. Coming in with a fairly low wait, Kali River Rapids averaged 12 minutes.
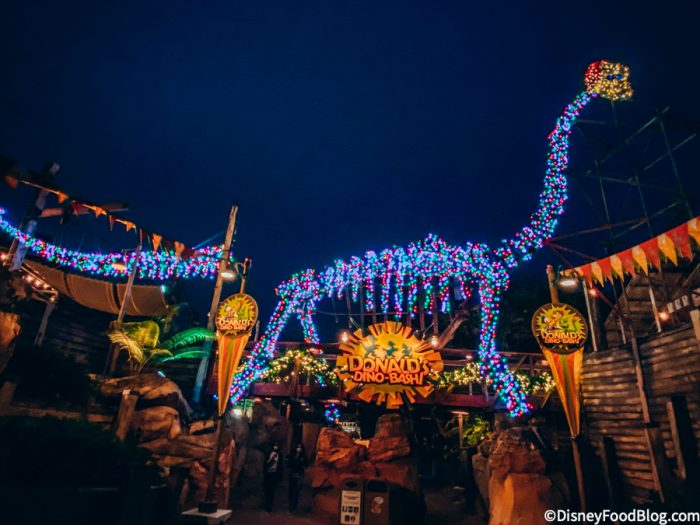
The lowest wait again was over in Dinoland U.S.A. at Triceratop Spin with a 5-minute average.
With these wait times, it’s possible to ride EVERYTHING in Animal Kingdom in one day. Although the Pandora attractions are a lengthier wait, everything else was less than 30 minutes on average. Even with a few attractions in the park and holiday crowds, these wait times somehow went down.
Here’s the latest news in Disney’s Animal Kingdom
Join the DFB Newsletter to get all the breaking news right in your inbox! Click here to Subscribe!
WE KNOW DISNEY.
YOU CAN, TOO.
Oh boy, planning a Disney trip can be quite the adventure, and we totally get it! But fear not, dear friends, we compiled EVERYTHING you need (and the things to avoid!) to plan the ULTIMATE Disney vacation.
Whether you're a rookie or a seasoned pro, our insider tips and tricks will have you exploring the parks like never before. So come along with us, and get planning your most magical vacation ever!
Did you guess which coaster had a low average wait time? Were you surprised? Let us know in the comments!

















 Our handy (and portable!) ebook guides make sure you get the best deals and can plan a vacation of a lifetime.

I try to go during Disney’s “off seasons” in early fall or the Jan/Feb/March timeframe, and these seem like average wait times, maybe just a tad shorter. I wonder if Disney usually operates at a 35-50 percent capacity. What would they consider 100 percent … just everyone packed in like sardines with zero moving room?
Really love the information that was posted could you offer this more times a year or at least every year after Christmas this will be very helpful thank you.