Thinking of visiting Disney World soon? Wondering what the wait times are looking like right now? Then you’re in the right place!
Each week, we take a look at the average wait times for all the rides in Disney World from the past week. Did wait times go down this past week? Let’s take a look!
Magic Kingdom
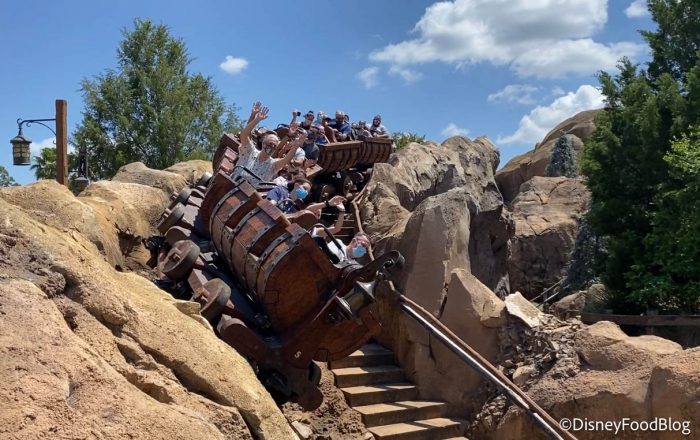
We’ll start our wait times journey in Magic Kingdom. Previously, Splash Mountain had the longest wait time in this park. This past week, it once again has the top spot, but its wait time was actually SHORTER (on average) than it was the previous week. Most recently, the average wait for Splash Mountain was 58 minutes, but this week it was down to 51 minutes!
Seven Dwarfs Mine Train went up just 1 minute from an average of 43 minutes to 44 minutes. Jungle Cruise went up slightly too — from 37 minutes to 39 minutes. Space Mountain also went up from 32 minutes to 39 minutes this week. And Pirates of the Caribbean went up from 31 to an average of 32 minutes.
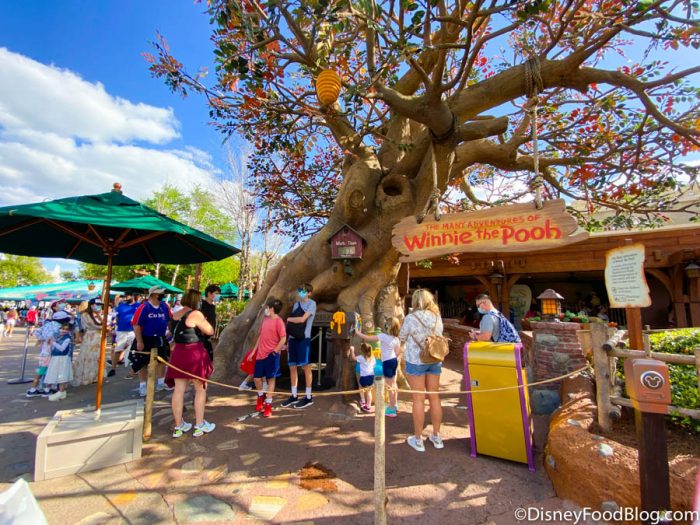
Peter Pan’s Flight stayed the same at 27 minutes. Astro Orbiter went up from 24 minutes on average to 27 minutes. The Many Adventures of Winnie the Pooh stayed the same at 22 minutes, while Big Thunder Mountain Railroad went down a few minutes from 24 minutes to 21 minutes.
Mickey’s PhilharMagic went down one minute from 22 minutes to 21 minutes. “it’s a small world” also went down a minute from 21 minutes on average to 20 minutes. The Tomorrowland Transit Authority PeopleMover also saw a small drop in wait times from 23 minutes to 20 minutes this week.
Most of the other rides only had small shifts of just 1 minute or so. Here’s a quick break-down of this past week’s wait times:
- Buzz Lightyear’s Space Ranger Spin — 18 minutes
- Haunted Mansion — 16 minutes
- Prince Charming Regal Carrousel — 15 minutes
- Tom Sawyer Island — 14 minutes
- Tomorrowland Speedway — 13 minutes
- Magic Carpets of Aladdin — 13 minutes
- Under the Sea – Journey of the Little Mermaid — 13 minutes
- Mad Tea Party — 11 minutes
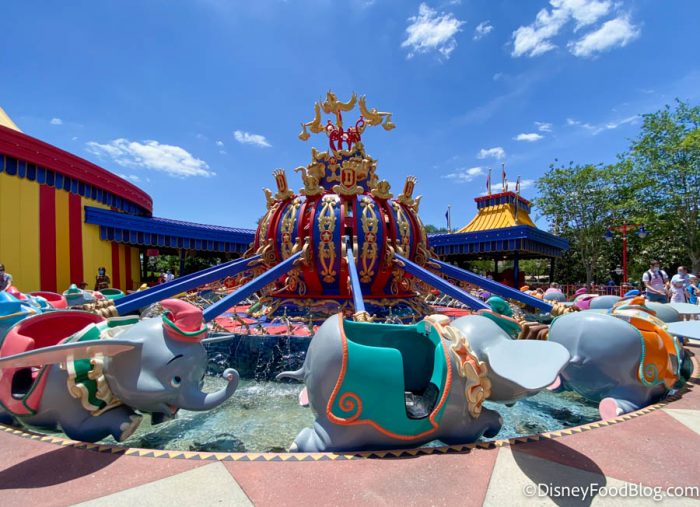
- Dumbo the Flying Elephant — 11 minutes
- Carousel of Progress — 9 minutes
- Country Bear Jamboree — 9 minutes
- Barnstormer featuring the Great Goofini — 8 minutes
- Liberty Square Riverboat — 2 minutes
- Enchanted Tiki Room — 0 minutes
- Swiss Family Robinson Treehouse — 0 minutes
EPCOT
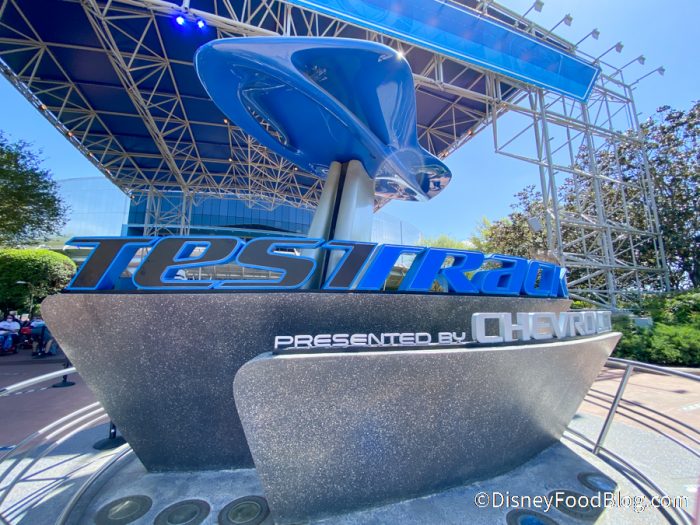
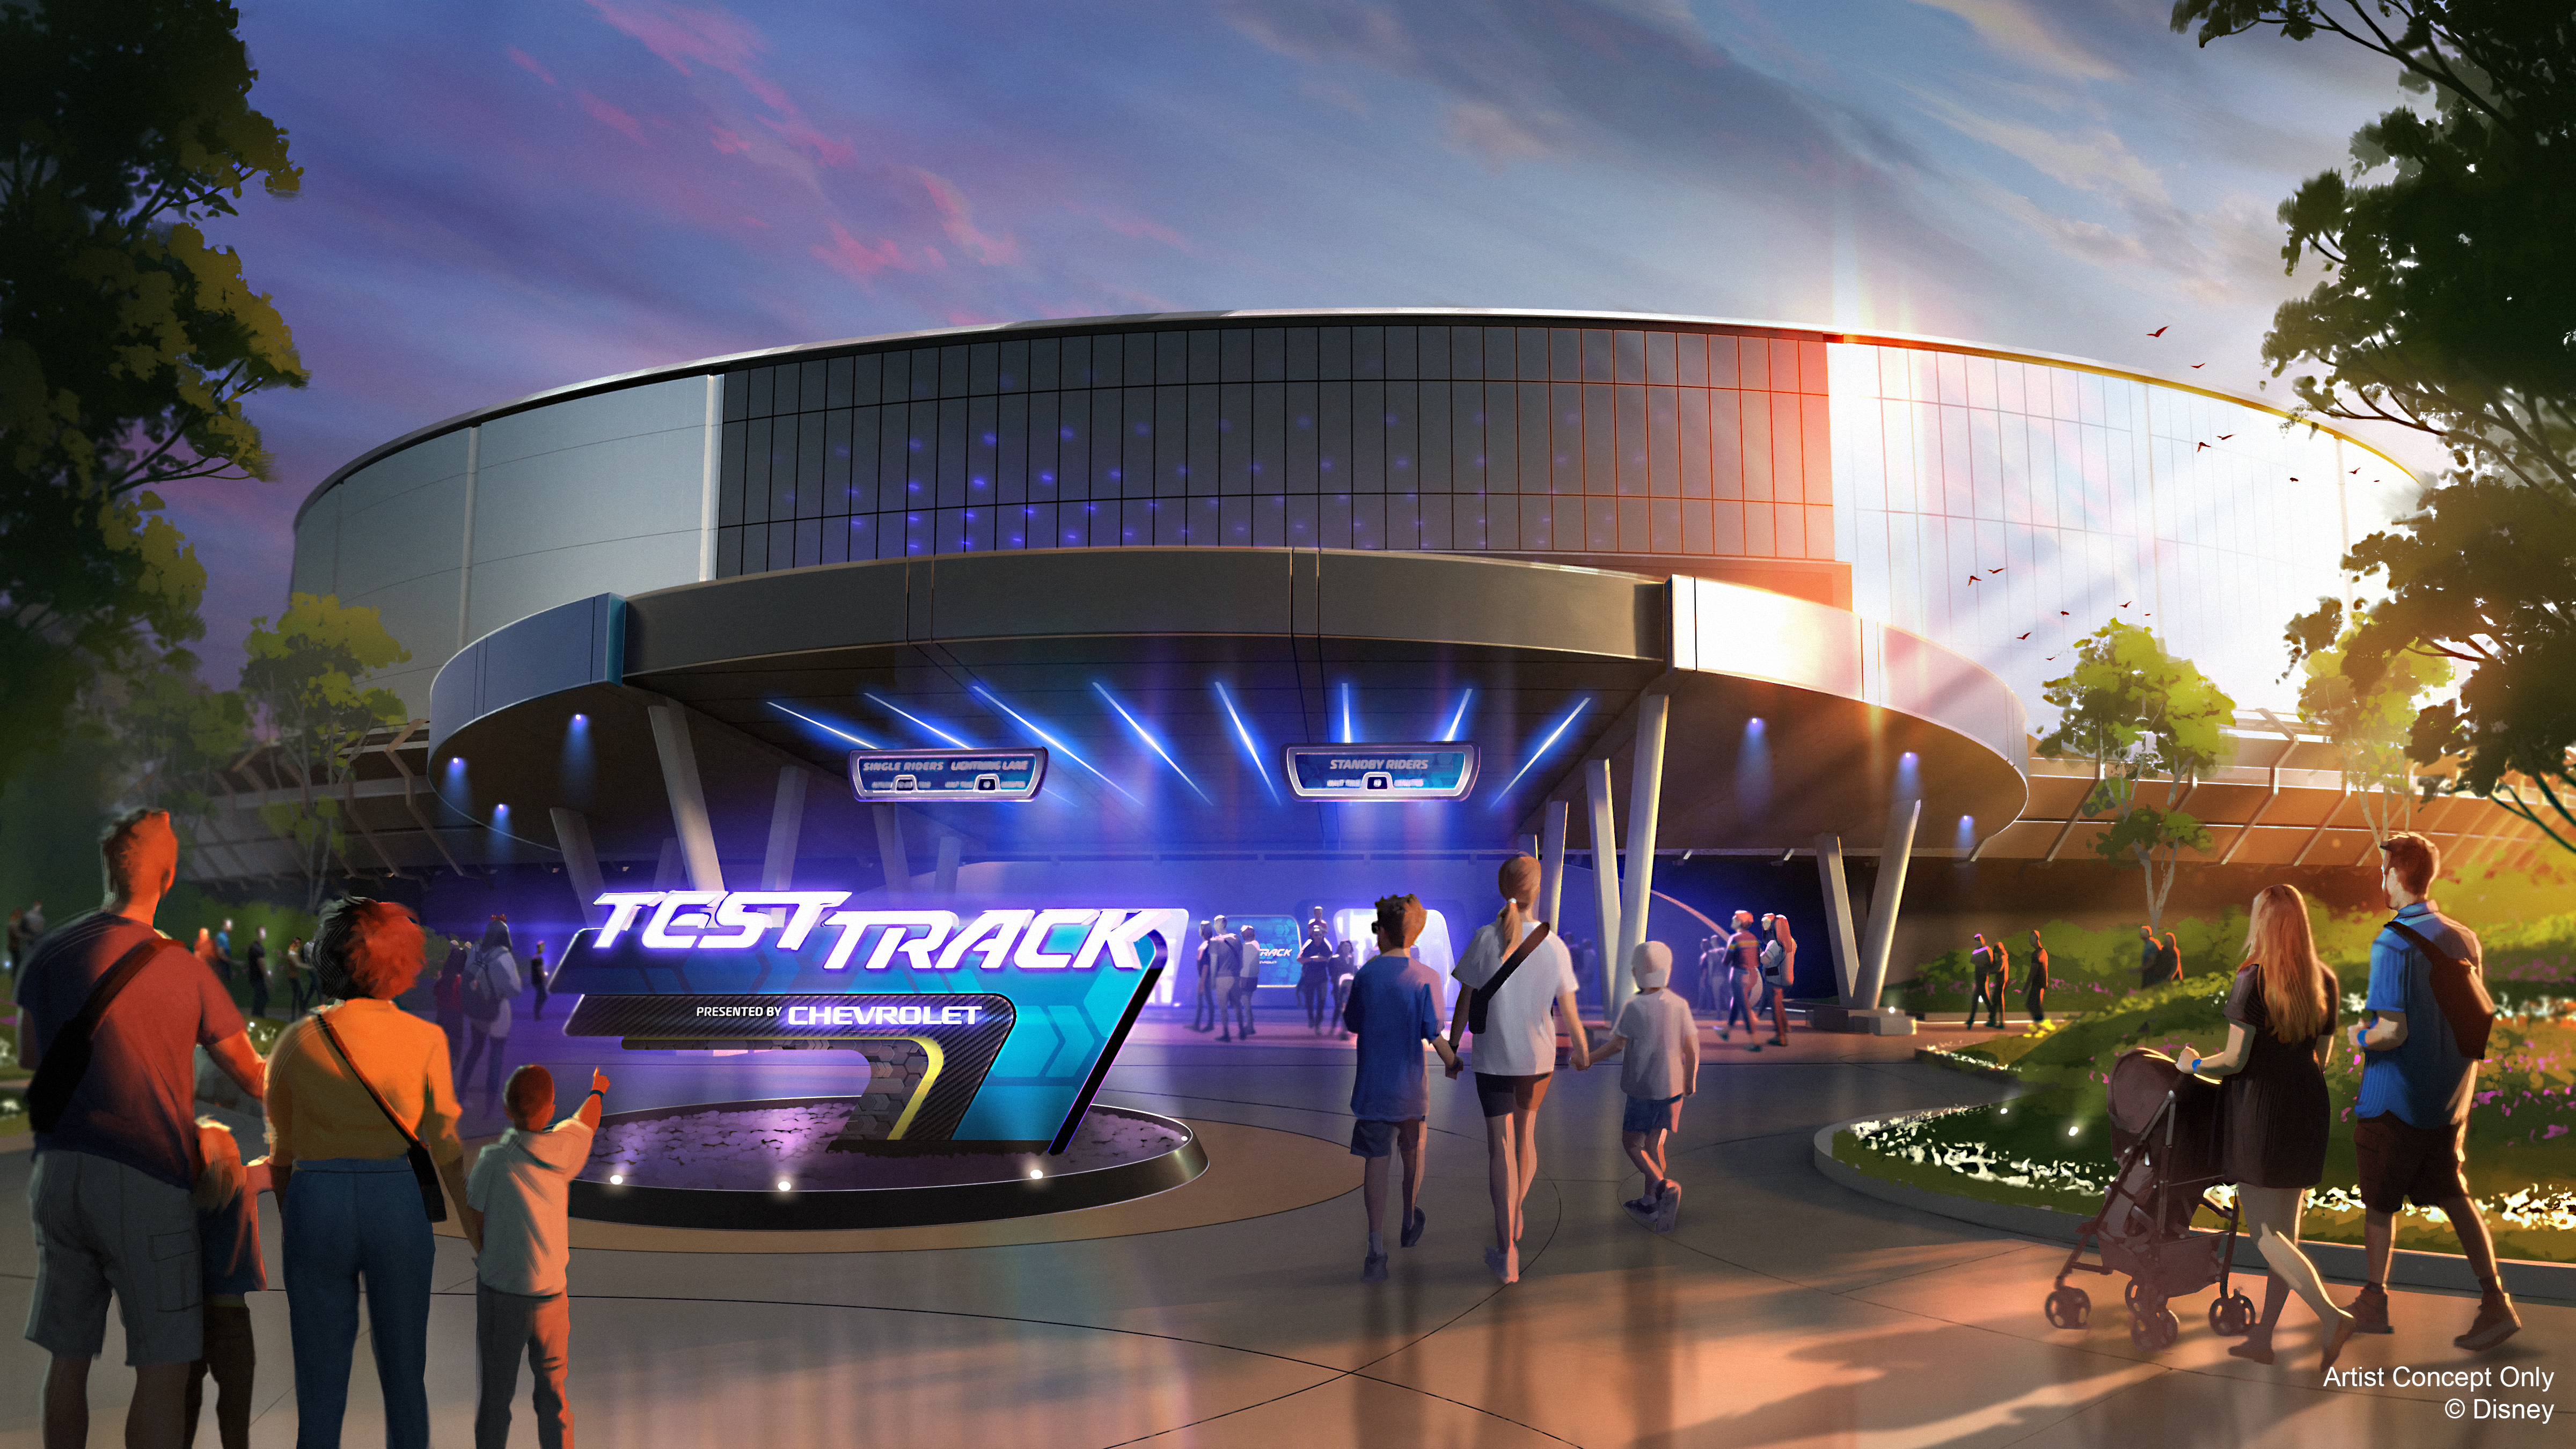
At EPCOT, Test Track and Soarin’ are typically near the top of the wait times list. During our round-up last week, they both had an average wait time of 47 minutes for the period we were looking at. During this past week, things have changed. BOTH rides had LONGER wait times this past week. Soarin’ Around the World was at 51 minutes while Test Track was at 50 minutes.
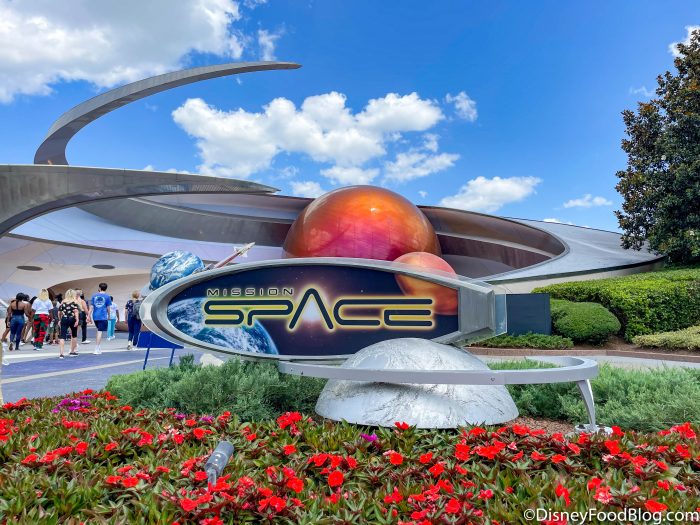
Wait times increased at Mission: SPACE too — from 37 minutes to 43 minutes, and at Frozen Ever After — from 38 minutes to 42 minutes.
All of the other rides in EPCOT had average wait times under 20 minutes this past week (some wait times dropped while a few increased ever so slightly). Check out our break-down below:
- Journey into Imagination — 16 minutes
- Spaceship Earth — 14 minutes
- The Seas with Nemo and Friends — 13 minutes
- Living with the Land — 8 minutes
- Gran Fiesta Tour — 6 minutes
- Shows with no waits: Reflections of China, Impressions de France, American Adventure, Awesome Planet, Beauty and the Beast Sing-Along, and Disney and Pixar Short Film Festival
Disney’s Hollywood Studios
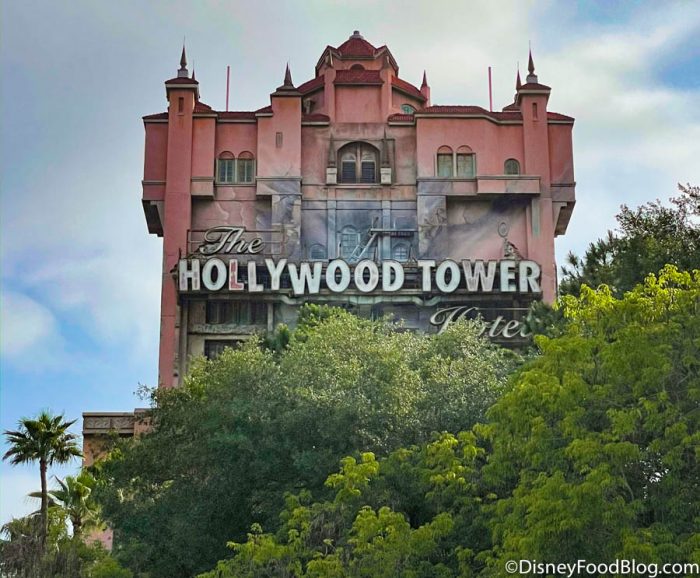
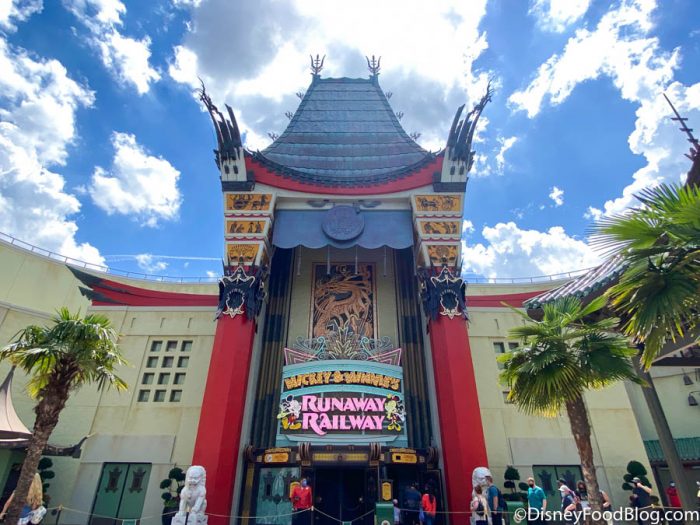
At Disney’s Hollywood Studios, quite a few wait times went up significantly this week. Slinky Dog Dash went from a previous average wait time of 62 minutes to 72 minutes this week. Twilight Zone Tower of Terror went up from 54 minutes to 65 minutes. Millennium Falcon: Smugglers Run went from 39 minutes to 44 minutes on average. Rock ‘n’ Roller Coaster featuring Aerosmith went from 35 minutes to 39 minutes this week. And Mickey & Minnie’s Runaway Railway went from 35 minutes to 38 minutes.
There were some slight increases or decreases at the other rides. Here’s a peek at their wait times from this past week:
- Toy Story Mania — 30 minutes
- Star Tours — The Adventures Continue — 27 minutes
- Muppet*Vision 3D — 26 minutes
- Alien Swirling Saucers — 25 minutes
- Lightning McQueen’s Racing Academy — 22 minutes
- Walt Disney Presents — 9 minutes (this attraction actually had a bigger jump than some of the others, going from 14 minutes previously to 9 minutes this past week)
Keep in mind that Rise of the Resistance doesn’t get averaged into our wait time calculations since the ride uses a Boarding Group system.
Disney’s Animal Kingdom
Finally, we end our wait times tour with a trip to Disney’s Animal Kingdom. Avatar Flight of Passage actually went DOWN in terms of average wait time this week from 72 minutes to 68 minutes. The wait time at Kilimanjaro Safaris went up slightly from 37 minutes to 40 minutes. Na’vi River Journey went up from 32 minutes to 34 minutes.
Dinosaur, on the other hand, went down from 35 minutes to 32 minutes. The other rides at the park had some slight movements up or down in terms of wait time. Here’s a look at what their average wait times looked like this week:
- It’s Tough to Be a Bug — 23 minutes
- Expedition Everest — 19 minutes
- Kali River Rapids — 18 minutes
- TriceraTop Spin — 6 minutes
- Gorilla Falls Exploration Trail –0 minutes
So, it was a bit of a mixed bag this past week. While wait times went down at some rides, they went UP for quite a few rides, particularly over at Disney’s Hollywood Studios.
We’ll keep monitoring Disney World’s ride wait times and let you know as we notice any changes in the future. Stay tuned for more updates.
Click here to see the BIG physical distancing changes made at Rise of the Resistance.
Join the DFB Newsletter to get all the breaking news right in your inbox! Click here to Subscribe!
WE KNOW DISNEY.
YOU CAN, TOO.

Oh boy, planning a Disney trip can be quite the adventure, and we totally get it! But fear not, dear friends, we compiled EVERYTHING you need (and the things to avoid!) to plan the ULTIMATE Disney vacation.
Whether you're a rookie or a seasoned pro, our insider tips and tricks will have you exploring the parks like never before. So come along with us, and get planning your most magical vacation ever!
Are you planing to visit Disney World soon? Tell us in the comments.













 Our handy (and portable!) ebook guides make sure you get the best deals and can plan a vacation of a lifetime.

I guess I am just an unlucky kind of guy. I was in Magic Kingdom, Hollywood Studios and EPCOt last week and all the wait times at all three park were higher than your posted averages. In some cases a lot more. Go figure.
I’m not sure what time of day these wait times were taken, but I was at Epcot last week and Test Track was 60 minutes and Soarin was 80 minutes. And both rides made announcements that wait times were longer than posted times because of ride stoppage. I’ve been to Disneyworld more than 30 times and I’ve never seen it busier!
Maaaaaaaaaaaaaaaan I just want to wait until the return of FastPass+. Going now just means “waiting for an hour at a time”. Back in 2019 I was able to do the entire trip with only a single line going over 40 minutes.
Curious, how many times during a day are you tracking the wait times to come to these averages? At the height of a day I’m sure the lines are far longer but during the morning or later hours far less – so is it 3 or 4 times a day that you use to create these numbers?
Andrea, we typically pull wait times 4-5 times per day.