Now that we’re heading into December, you might be wondering what Disney World crowds look like right after Thanksgiving. But wonder no more!
The week of Thanksgiving brought lots of crowds and high wait times, but the week after the holiday looks a little bit different. Think of it as the calm before the storm of holiday travelers start descending on Disney World! If you want to look at the numbers, we’ve compiled all the average wait times from this past week.
If you’re planning a Disney World trip and wondering whether Genie+ is a worthy investment, one of the best ways to make that determination is to observe wait times around Disney World. While wait times can fluctuate quite a bit from day to day and month to month, a few rides typically come out on top.
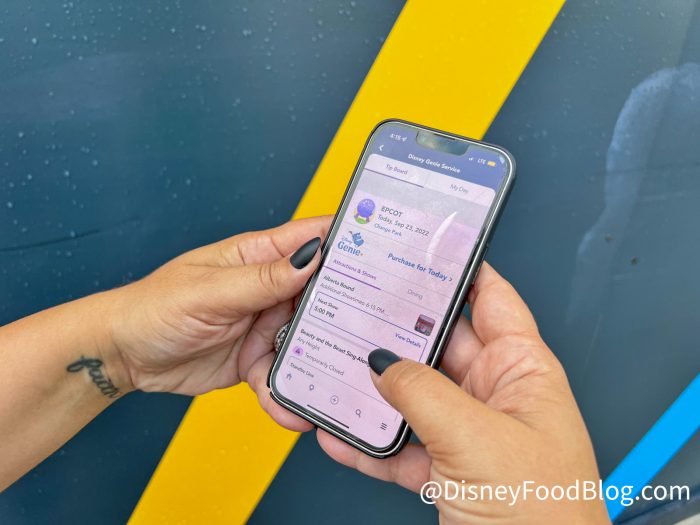
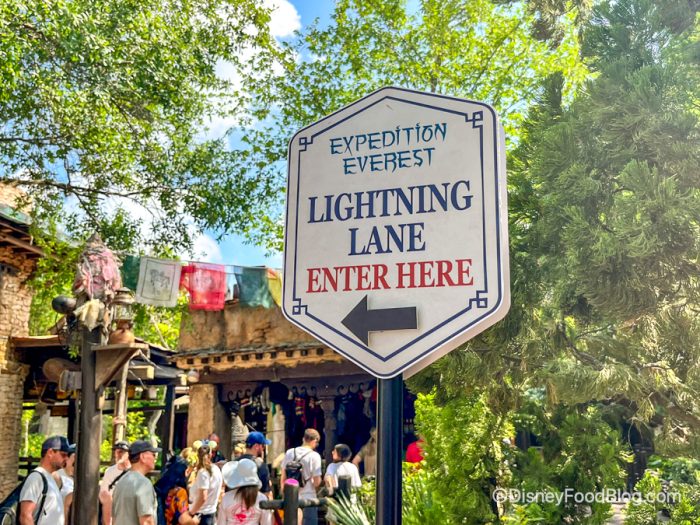
Depending on your budget and how many people are in your party, Genie+ can be a pricey purchase, fluctuating between $15 and $29 per person, per day recently. Your Genie+ purchase gets you access to Lightning Lane reservations (one at a time), which is not that different from the old FastPass system, but you might want to consult our guide before getting to Disney World.
Ultimately, we recommend making a list of all your favorite Disney World rides BEFORE scrolling down, and if all your faves tend to have long wait times, you might need to consider getting Genie+. Now without further ado, let’s take a look below for all the average wait times of every Disney World ride this past week.
Magic Kingdom
We’re starting out with Magic Kingdom, where Seven Dwarfs Mine Train had the longest average wait time at 64 minutes! It averaged 76 minutes last week, so that’s a small decrease.
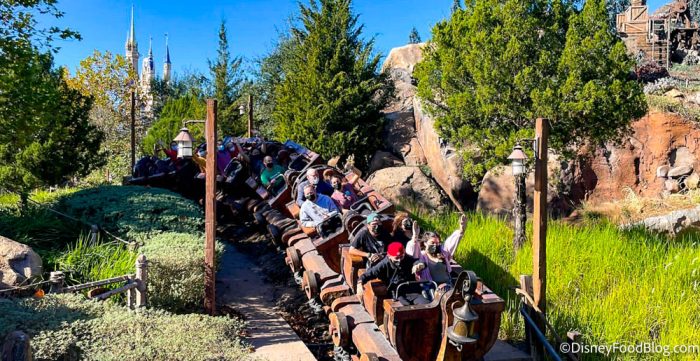
Next, Peter Pan’s Flight averaged 59 minutes, followed by Space Mountain at 40 minutes, Haunted Mansion at 33 minutes, Big Thunder Mountain Railroad at 31 minutes, and Buzz Lightyear’s Space Ranger Spin at 28 minutes. The Astro Orbiter, Splash Mountain, and Pirates of the Caribbean all averaged 27 minutes.
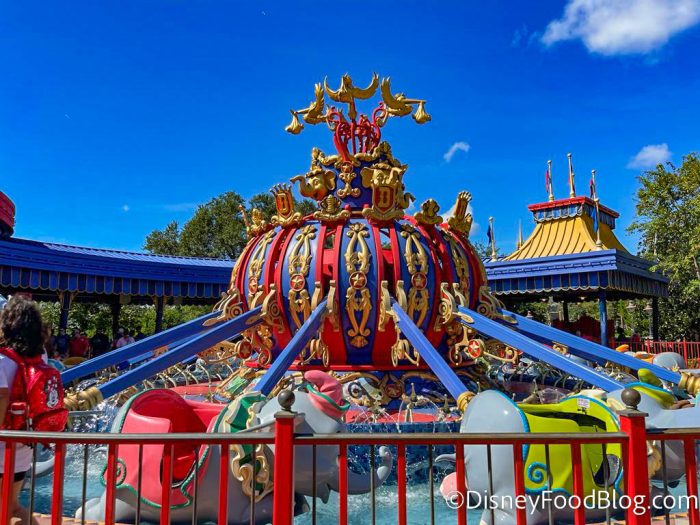
After that, the Many Adventures of Winnie the Pooh averaged 25 minutes, “it’s a small world” averaged 19 minutes, Under the Sea – Journey of the Little Mermaid averaged 19 minutes, and Magic Carpets of Aladdin averaged 16 minutes. The Barnstormer featuring the Great Goofini, Dumbo the Flying Elephant, Tomorrowland Speedway, and Mickey’s PhilharMagic all averaged 14 minutes. Prince Charming Regal Carrousel averaged 12 minutes.
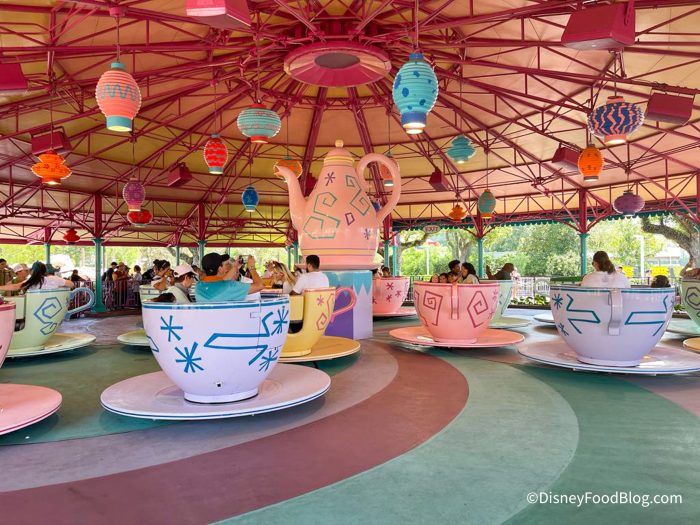
Next, Tomorrowland Transit Authority PeopleMover averaged 11 minutes, the Mad Tea Party averaged 10 minutes, and the Enchanted Tiki Room averaged 6 minutes. The Swiss Family Robinson Treehouse, Liberty Square Riverboat, and Carousel of Progress all averaged 5 minutes.
The Hall of Presidents averaged a wait of 2 minutes, while the Country Bear Jamboree and Tom Sawyer Island averaged no wait.
Why you’ll want to be in Magic Kingdom on December 23rd!
EPCOT
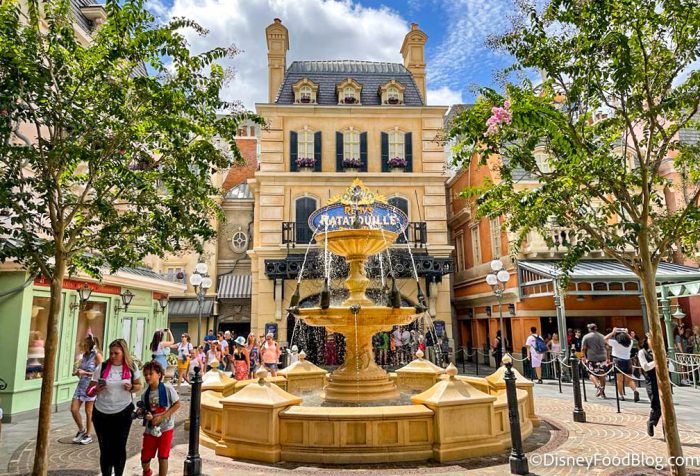
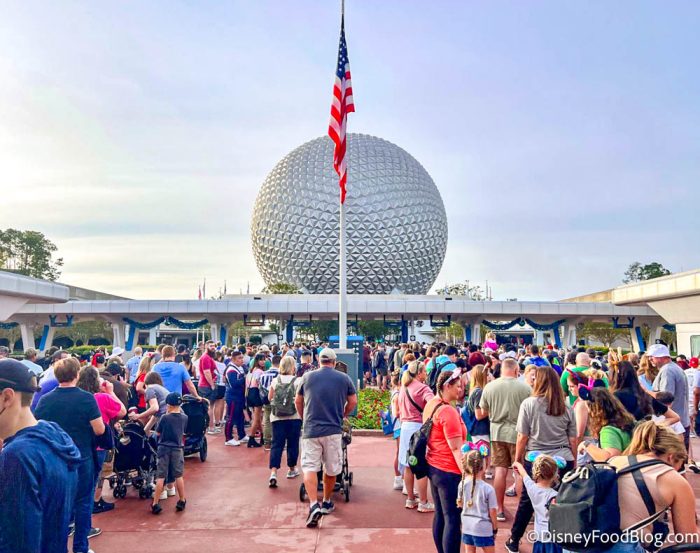
Now let’s make our where to EPCOT, where the ride with the longest average wait time was once again Remy’s Ratatouille Adventure, with an average wait time of 71 minutes, compared to last week’s high average of 92 minutes. Frozen Ever After had an average wait time of 64 minutes, which was a fair decrease from last week’s average of 78 minutes.
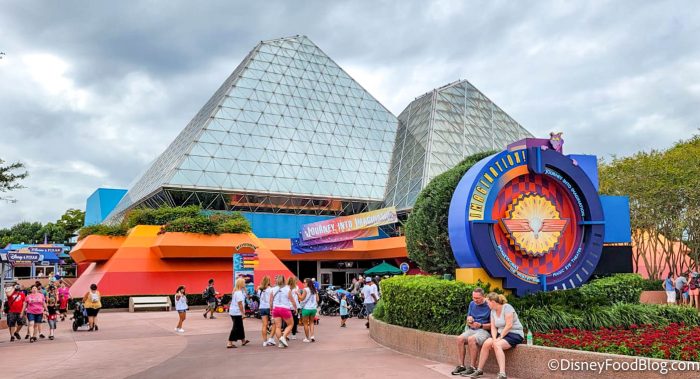
Next up was Test Track at 55 minutes, Soarin’ at 34 minutes, and Mission: SPACE at 19 minutes. Spaceship Earth and Turtle Talk with Crush averaged 12 minutes, The Seas with Nemo and Friends averaged 10 minutes, Journey into Imagination averaged 9 minutes, and Gran Fiesta Tour and Living with the Land averaged 8 minutes.
Awesome Planet, Beauty and the Beast Sing-Along, Disney and Pixar Short Film Festival, Impressions de France, and Reflections of China had no wait times this week.
Why you should be on the lookout for Winnie the Pooh in EPCOT right now!
Hollywood Studios
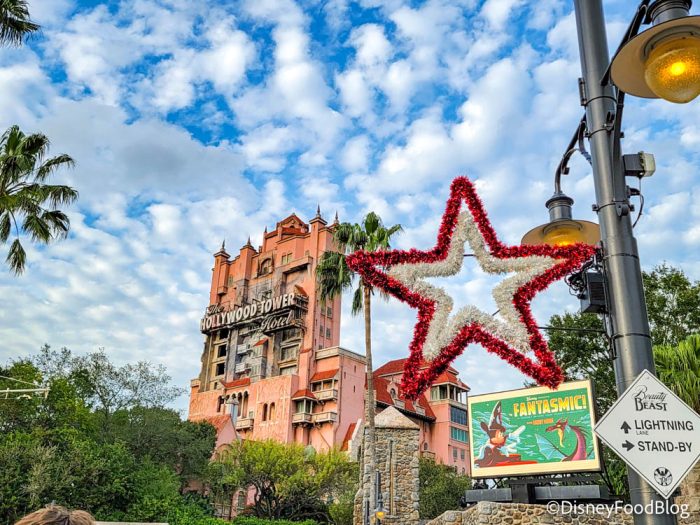
Now it’s time to visit Hollywood Studios where for the third week in a row, Tower of Terror topped the list with an average wait time of 94 minutes, which is a pretty big decrease from the average wait time of 134 minutes last week. Rise of the Resistance and Slinky Dog Dash tied for second place with average wait times of 81 minutes.
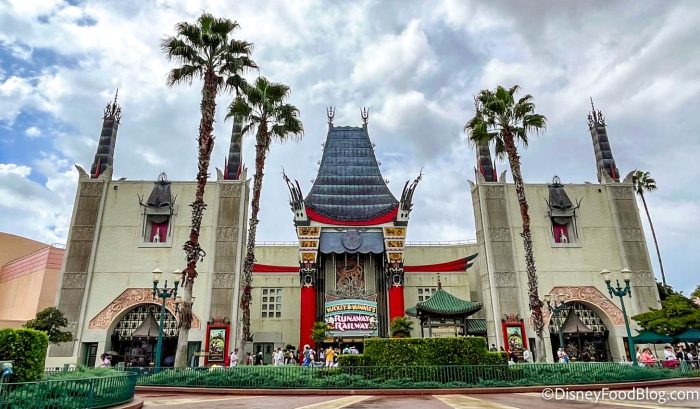
Next, Toy Story Mania averaged 58 minutes, and Rock ‘n’ Roller Coaster featuring Aerosmith and Mickey and Minnie’s Runaway Railway averaged 56 minutes. Millennium Falcon: Smugglers Run averaged 50 minutes,
After that, Alien Swirling Saucers averaged 32 minutes, Star Tours – The Adventures Continue averaged 16 minutes, Lightning McQueen’s Racing Academy averaged 14 minutes, Muppet*Vision 3D averaged 9 minutes, and Walt Disney Presents averaged 8 minutes.
The BEST restaurants in Disney’s Hollywood Studios!
Animal Kingdom
Finally, it’s time to head over to Animal Kingdom, where Avatar Flight of Passage had the longest average wait time of 85 minutes. Last week, the average was a whopping 135 minutes.
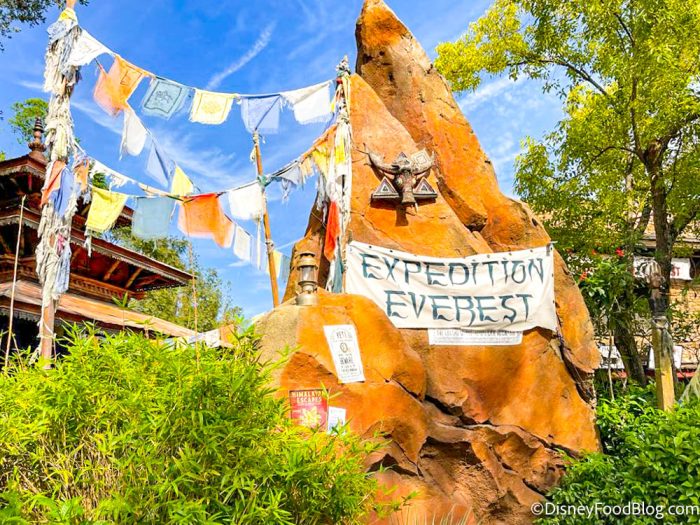
Next up was Na’vi River Journey at 52 minutes, Kilimanjaro Safaris at 37 minutes, Expedition Everest at 19 minutes, DINOSAUR at 13 minutes, and Kali River Rapids at 11 minutes.
It’s Tough to Be a Bug averaged 10 minutes and Triceratop Spin averaged 8 minutes. Both The Boneyard and Gorilla Falls Exploration Trail averaged no wait time.
The BEST restaurants in Animal Kingdom!
Overall, wait times decreased this week, although they didn’t exactly go down significantly. If you’re planning a visit during any holiday it’s safe to expect wait times to be on the higher end of the spectrum, and Genie+ can be a worthy investment.
Keep following DFB for more Disney World news and updates!
When Disney World Will Sell Out in 2023
Planning a Trip to Disney World? We’ve Got Everything You Need to Know
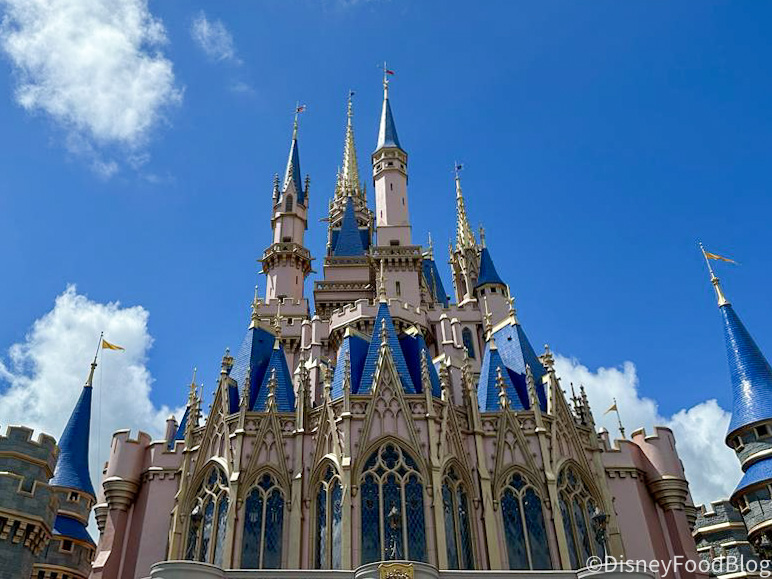
Tips, Hints, Lists, and Videos for Planning the BEST Disney World Trip
Join the DFB Newsletter to Get All the Latest Disney News Delivered Right to Your Inbox! Click Here to Subscribe
What’s your favorite ride in Disney World? Let us know in the comments!


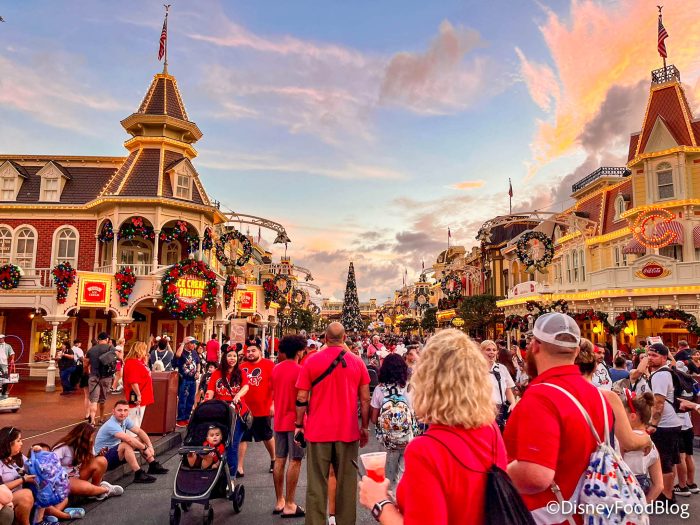
 Our handy (and portable!) ebook guides make sure you get the best deals and can plan a vacation of a lifetime.

TRENDING NOW
Don't forget about this Magic Kingdom fireworks change!
Here's everything you need to know about the upcoming closure of DinoLand at Animal Kingdom.
This water park upgrade could save your day!
Two popular rides are temporarily closing at Disneyland!
We rounded up the best Disney tees on Amazon so you don't have to!
If you don't watch out for this reoccurring Disney World hotel issue, you might have...
This snack is a LIFESAVER during a long Disney day!
If this is your first time visiting Disney World, these hotels might be the right...
A new nonstop flight is headed to Orlando International Airport.
We have exciting UPDATES about Disney's NEW 'Greatest Showman' musical.
See what Disney is serving up at the 2025 EPCOT Flower and Garden Festival Northern...
People come to this next food studio at the Festival of the Arts because it's Encanto-themed,...
Disney shared a new clip that provides our first views inside Test Track 3.0.
Here are a few things we never thought we’d buy in Disney World, but they...
We swear by these Orlando International Airport hacks.
Disney+ subscribers need to be taking advantage of these perks!
Check out the special Festival drink at the UK Beer Cart for the Flower &...
We’re ABANDONING the Disney World theme parks today and trading them in for a shopping...
Check out the four new specialty drinks at Joffrey's in EPCOT for the Flower &...
There's one frustrating/annoying reason why you should SKIP Magic Kingdom in 2025!