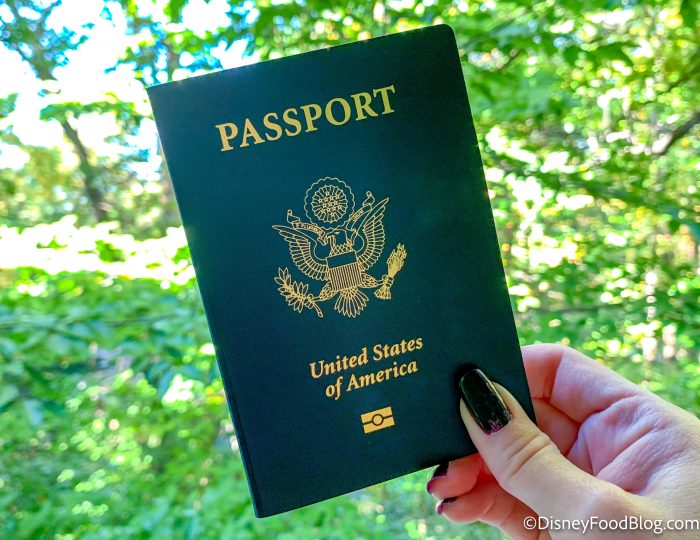
I am always nervous about losing my ID at the airport, how about you?
You have to have it out at TSA, then you have to stow it quickly because you can’t have it in your hand or your pocket as you go through the body scanners or metal detectors. And then I’m always carrying a larger bag than I typically carry as my personal item, but still have my important items like my wallet and cell phone stored in my smaller bag I will carry with me every day at my destination. I thought I had found a perfect solution for this by wearing a belt bag — but then I found out these can cause some problems at the airport that you might not be expecting.


 Our handy (and portable!) ebook guides make sure you get the best deals and can plan a vacation of a lifetime.
